
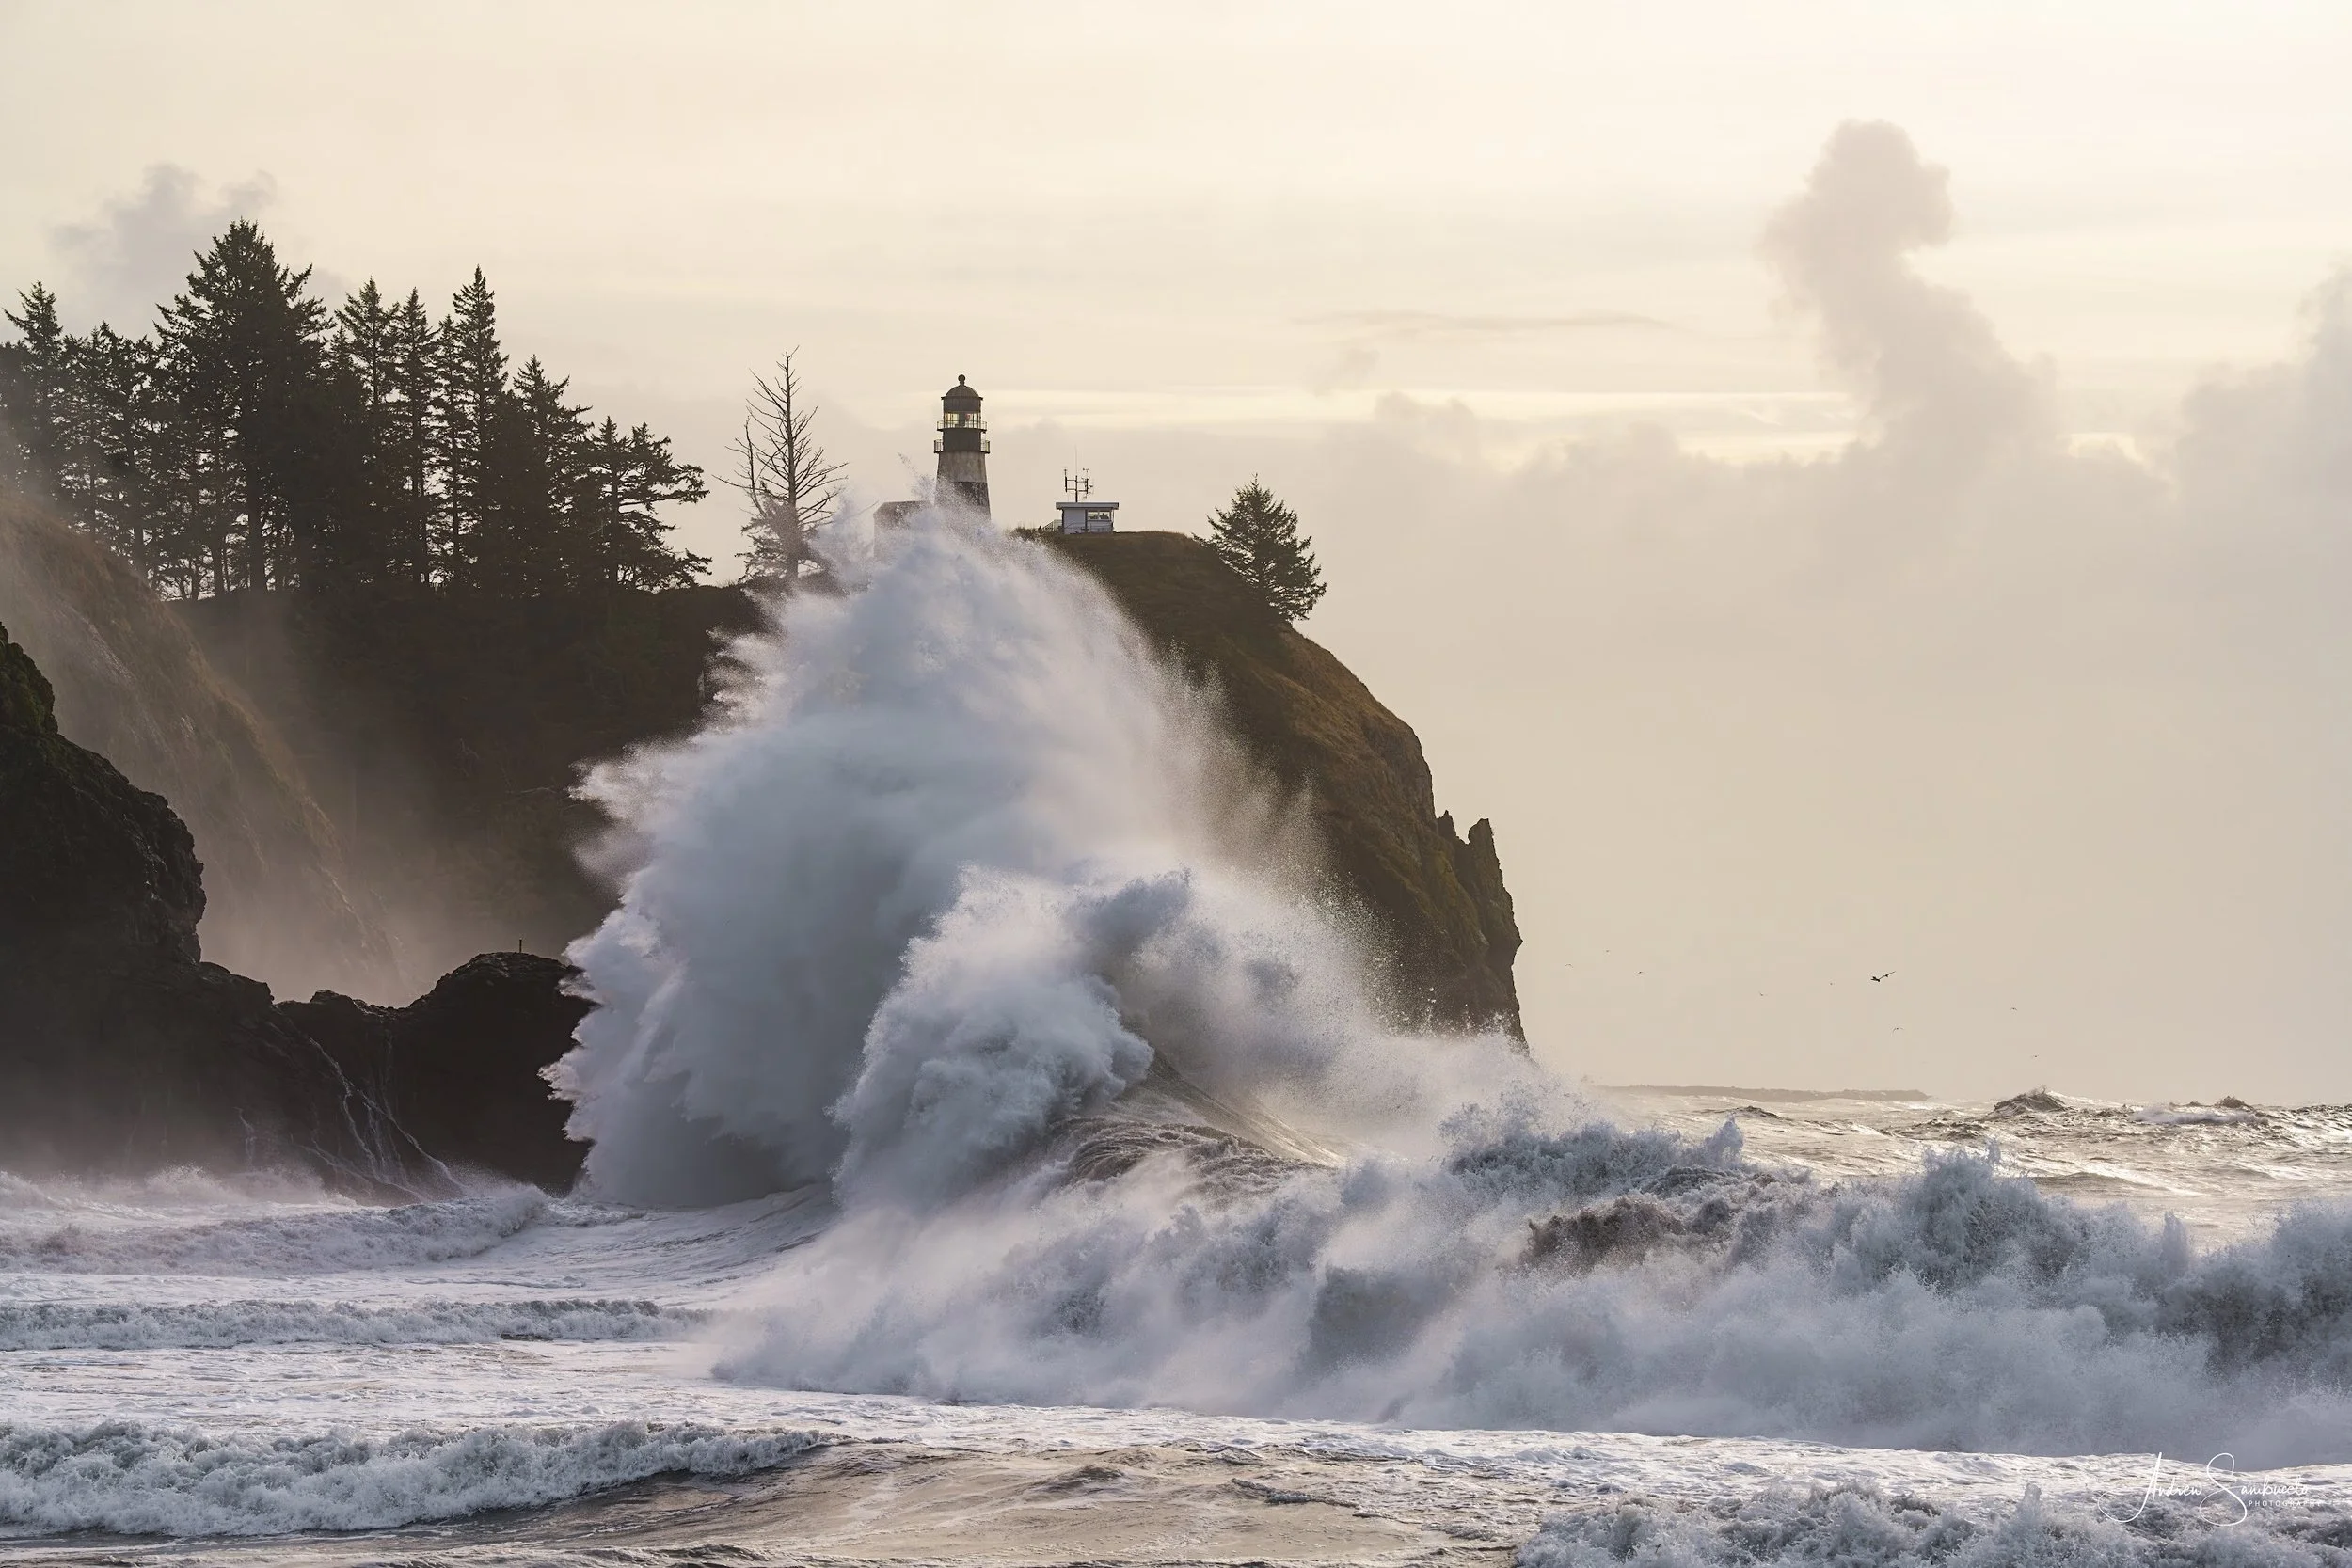
Cape Disappointment, Washington, November 8.
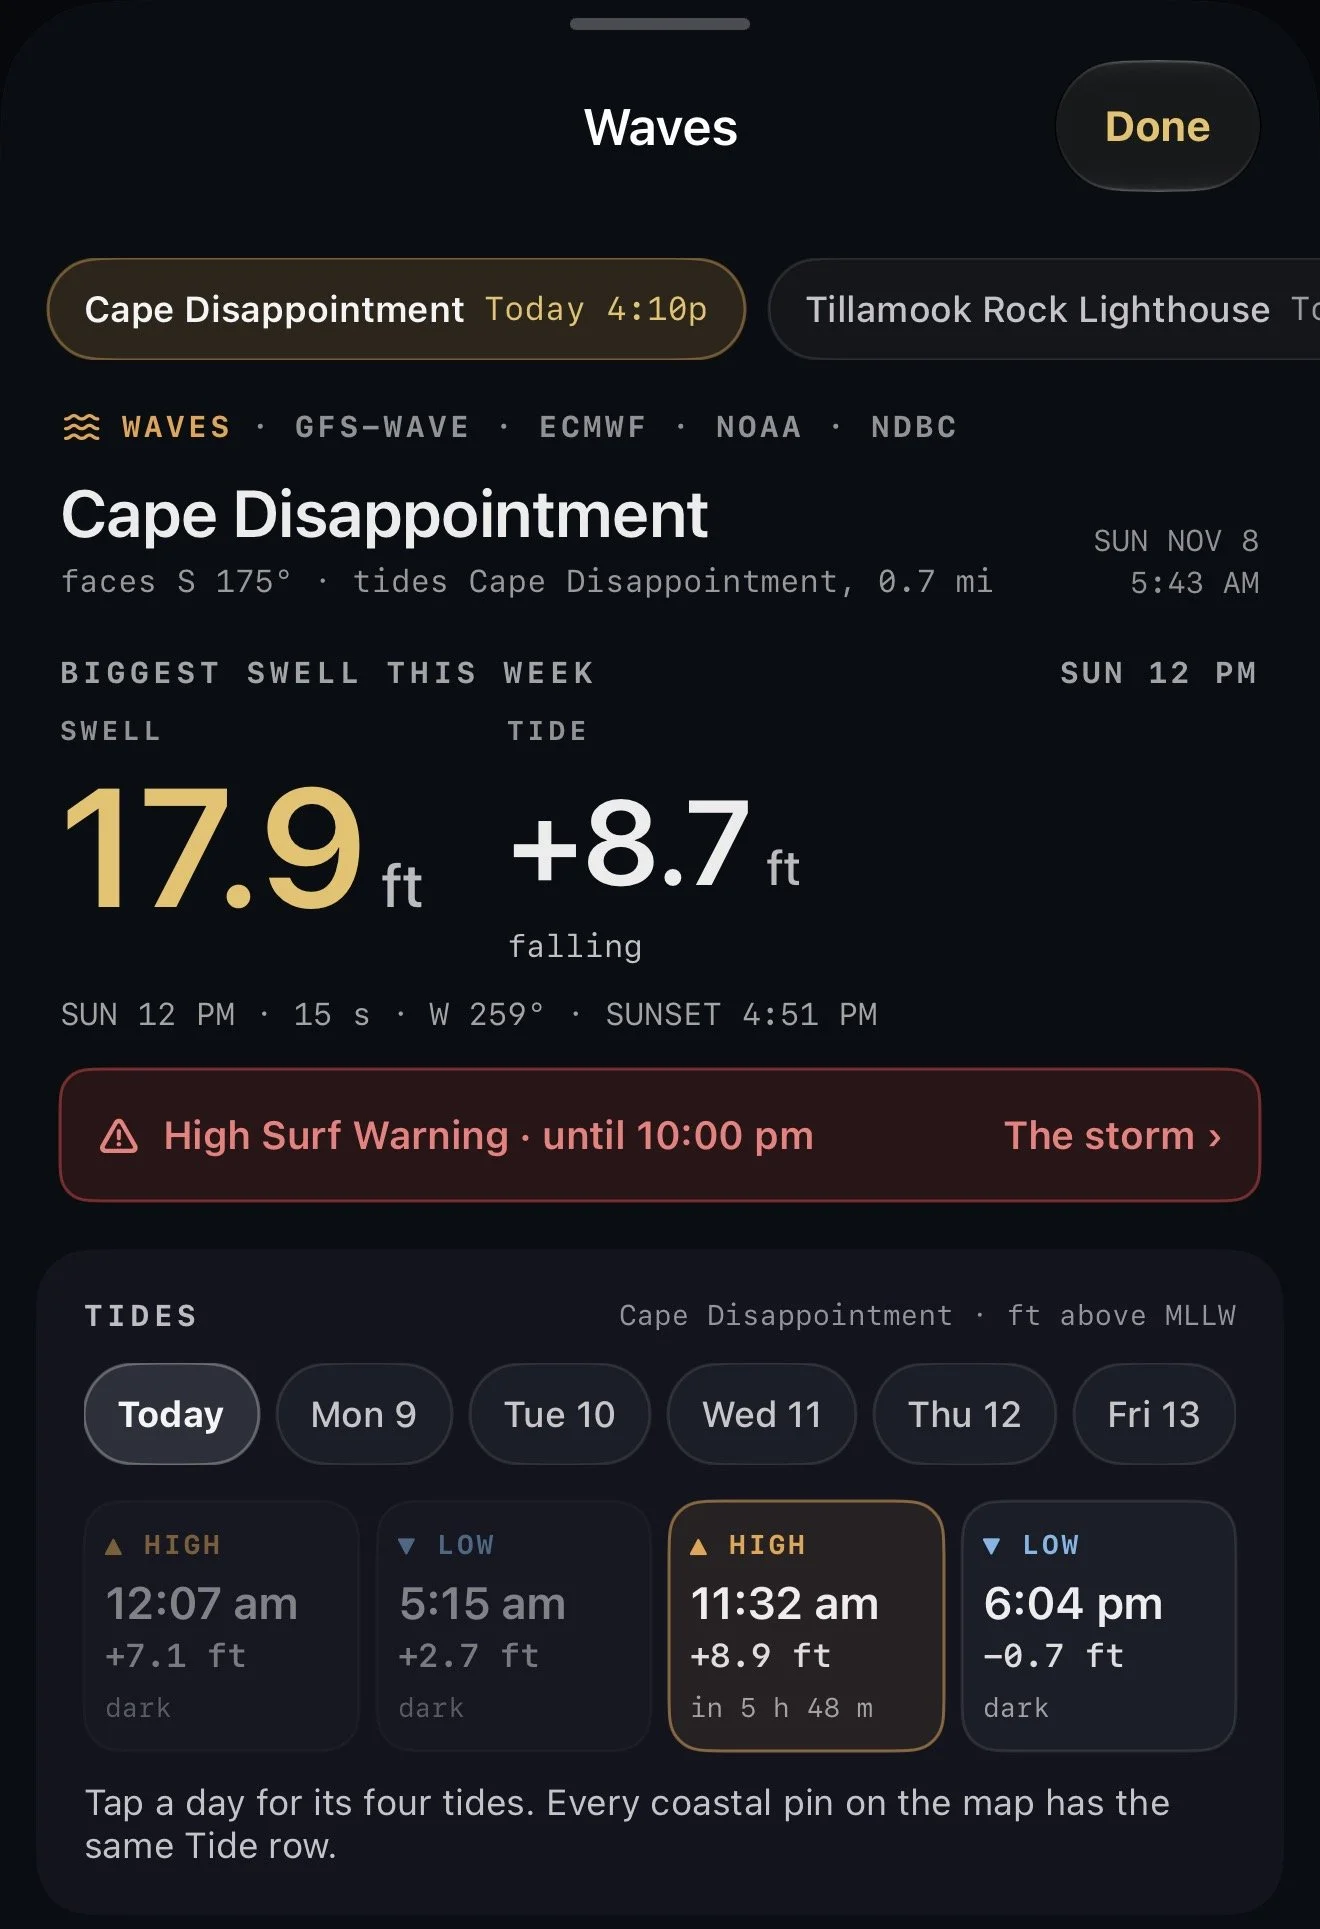
That's Cape Disappointment, at the mouth of the Columbia, on November 8. It wasn't a king tide. The high that day was +8.9 ft, an ordinary winter high. What made the picture was the swell behind it: 17.9 ft at 15 seconds, due within half an hour of the high. GoldenLight showed me both that morning.
Next week the tide itself does the climbing. The first king tides of the season run November 23 to 27 on the Oregon coast and Washington's outer coast, and at that same Cape Disappointment station the highs reach +9.6 to +10.0 ft. Two more runs follow: December 22 to 26 and January 20 to 24.
A king tide is just a very high tide: the sun and moon pulling together while the moon is near its closest to Earth. On the coast it means water where it almost never reaches. The sea comes up against the headlands, spray goes over rocks that sit dry most of the year, and six or seven hours later the low tide drains farther than on any other day.
I plan for them every winter, and I built that planning into GoldenLight. Here is how it works.
Where the tides live
On the Home screen, the tides are inside the Waves chip. It reads the coastal places you keep in the app, and in a king tide week its bottom line says so: KING TIDES MON–FRI. In a quiet week it counts down to the next run instead.
Tap it, and the Waves sheet opens on your coastal place. Under the week's biggest swell is the Tides card. Pick a day and every high and low shows up as its own tile: the time, the height, a countdown to the next one, and a KING tag on a king tide high.
The part I use most is the small word under each tide: the light it falls in. Golden hour, blue hour, dusk, dawn or dark. A minus low tide in golden hour is a wet-sand mirror. A minus low tide in the dark is a long walk with a headlamp. On November 8 the evening low was −0.7 ft at 6:04 pm, and the app said what it was: dark. That one word saves me a lot of trips.
The king tide card
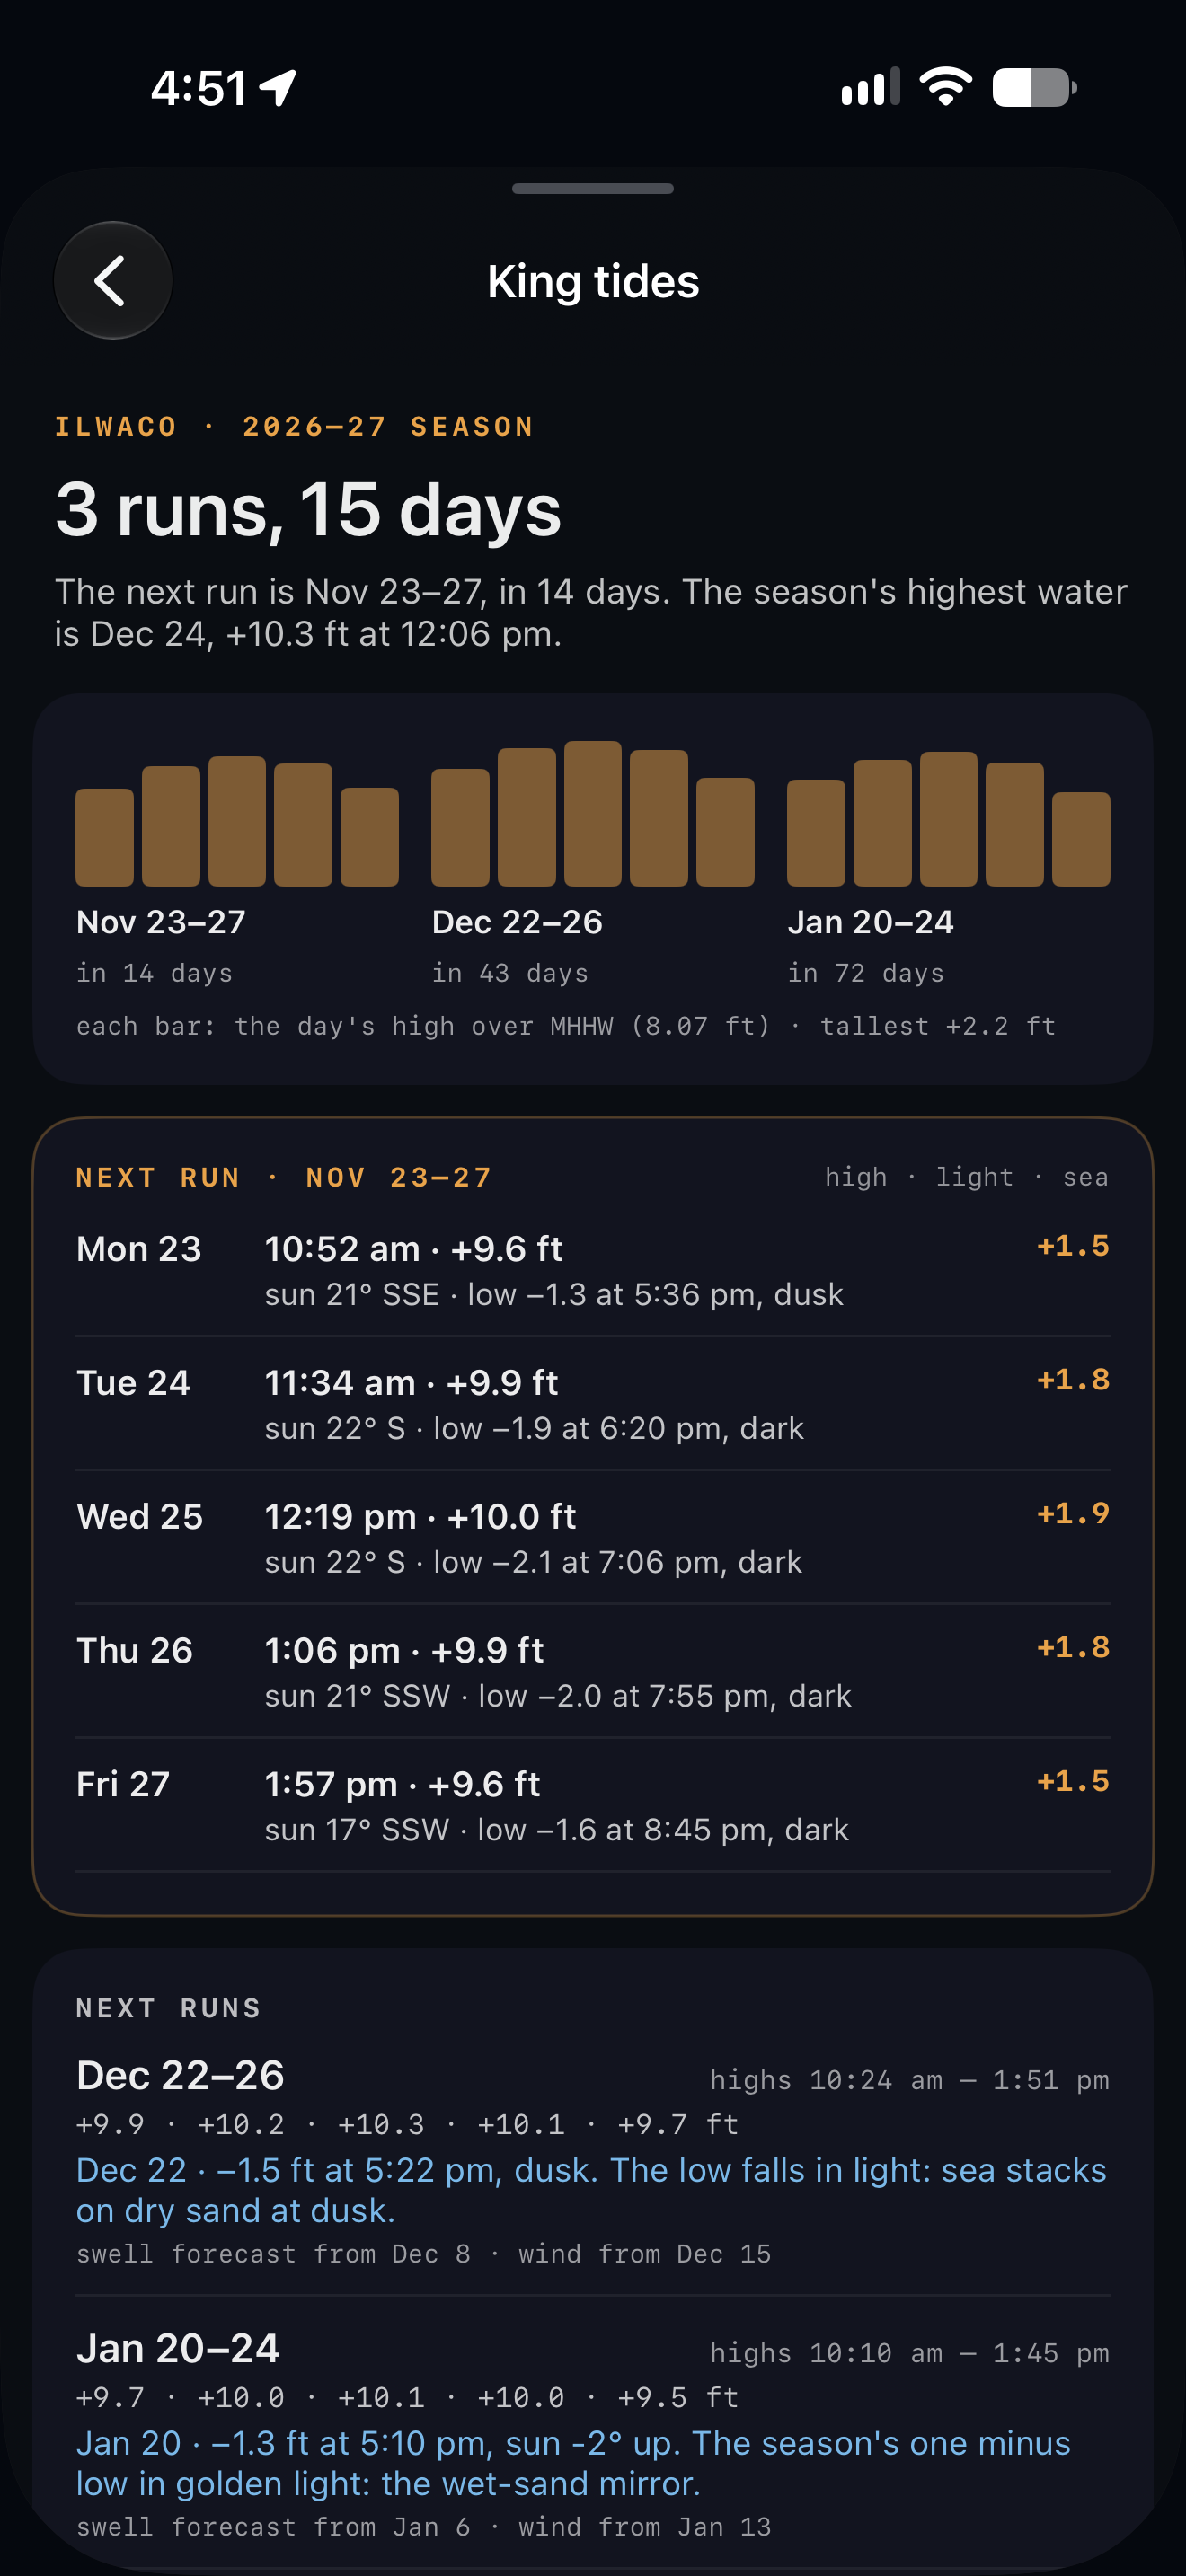
During the season a King Tides card sits in the same sheet. It shows one bar for each day of the run, so you can see which day of the five has the biggest high, and how far it climbs above an ordinary high tide.
Under the bars it tells you two things I used to work out by hand:
What today's high meets. The swell forecast at that high, and whether the wind is offshore and clean or onshore and messy. A king tide on a flat sea is a high-water photograph. A king tide with a long-period swell behind it is a different day entirely.
The low side. Whether this run's minus low tides fall in daylight or after dark, and if they're in the dark, the next one that isn't.
The whole season on one screen
Tap The king tide season and the app lays out the winter. For Cape Disappointment it reads: three runs, fifteen days, the November run day by day from +9.6 ft on Monday to +10.0 ft on Wednesday, and the season's highest water on December 24, +10.3 ft at 12:06 pm.
It also answers the low side for every run. Most of November's minus lows fall after dark. December 22's falls at dusk, and the app puts it plainly: sea stacks on dry sand at dusk. January 20's is the season's one minus low in golden light: the wet-sand mirror. That's a date I've now got circled.
The screen puts the idea I plan around into two lines:
The high: late morning to midday. Water where it rarely reaches; best with a swell behind it.
The low: six to seven hours later. The year's lowest water; worth it when it falls in light.
From there, Plan a trip puts the run on your Calendar as a trip at that place, and Remind me sends a note the evening before each king tide day.
Timing is everything
The best king tide days are the ones where a big, long-period swell arrives on the high, the way it did at Cape Disappointment on November 8. The Waves sheet looks for that for you. When a high tide, a long-period swell and the right wind line up at one of your places, it shows a shooting window with a title like Impact on a king high, the times, and what the sea, the tide and the wind are doing at the peak. Turn on the Waves alert in Settings → Notifications and it tells you at 6 pm the evening before.
Storms also push real water above the prediction. Where a NOAA tide gauge is close, the app compares what the gauge measures with what was predicted, and shows the difference. On a stormy king tide, the high can run a foot or more over what the tide table says.
Planning further out
Calendar. King tide days are marked with an amber wave on the Month screen, and listed under Coming up.
Trips → Find king tides. Pick a spot and the app reads a full year of tides there and lists the king tide days.
Map Scout. Every saved pin on the coast has a Tide row. Drag the time slider to any day and it shows that day's tides.
Where it works
The tides come from NOAA, so they work on US coasts. King tide days are marked where the state publishes official dates: Oregon, Washington and California. Washington's dates change from place to place, and the app uses the ones for your spot. California's first run this season is November 24 to 26.
Share what you get
Each of these king tide projects collects photographs to record how high the water reaches. The King Tides card has a link straight to your coast's project: the Oregon King Tides Project, the California King Tides Project, or Washington's King Tides on MyCoast. I'd love to see yours there.
One plain thing before you go: a king tide with a swell behind it puts water where people are used to standing. Watch a few sets before you walk out, and keep the ocean in front of you.
GoldenLight is on the App Store for iPhone. It's free to download, and the yearly plan opens with a free month.
Get GoldenLight on the App Store →
— Andy